
The problem
A regional grid operator scheduled generation and flexibility from a spreadsheet forecast that repeated last week’s profile with a weather correction. It was fine on an average Tuesday and wrong on every hot afternoon, public holiday and school break — exactly the days when a wrong forecast is expensive.
The dispatch team asked for two things a point forecast cannot give: how much demand to expect at every site, and how sure the model is.
What we built
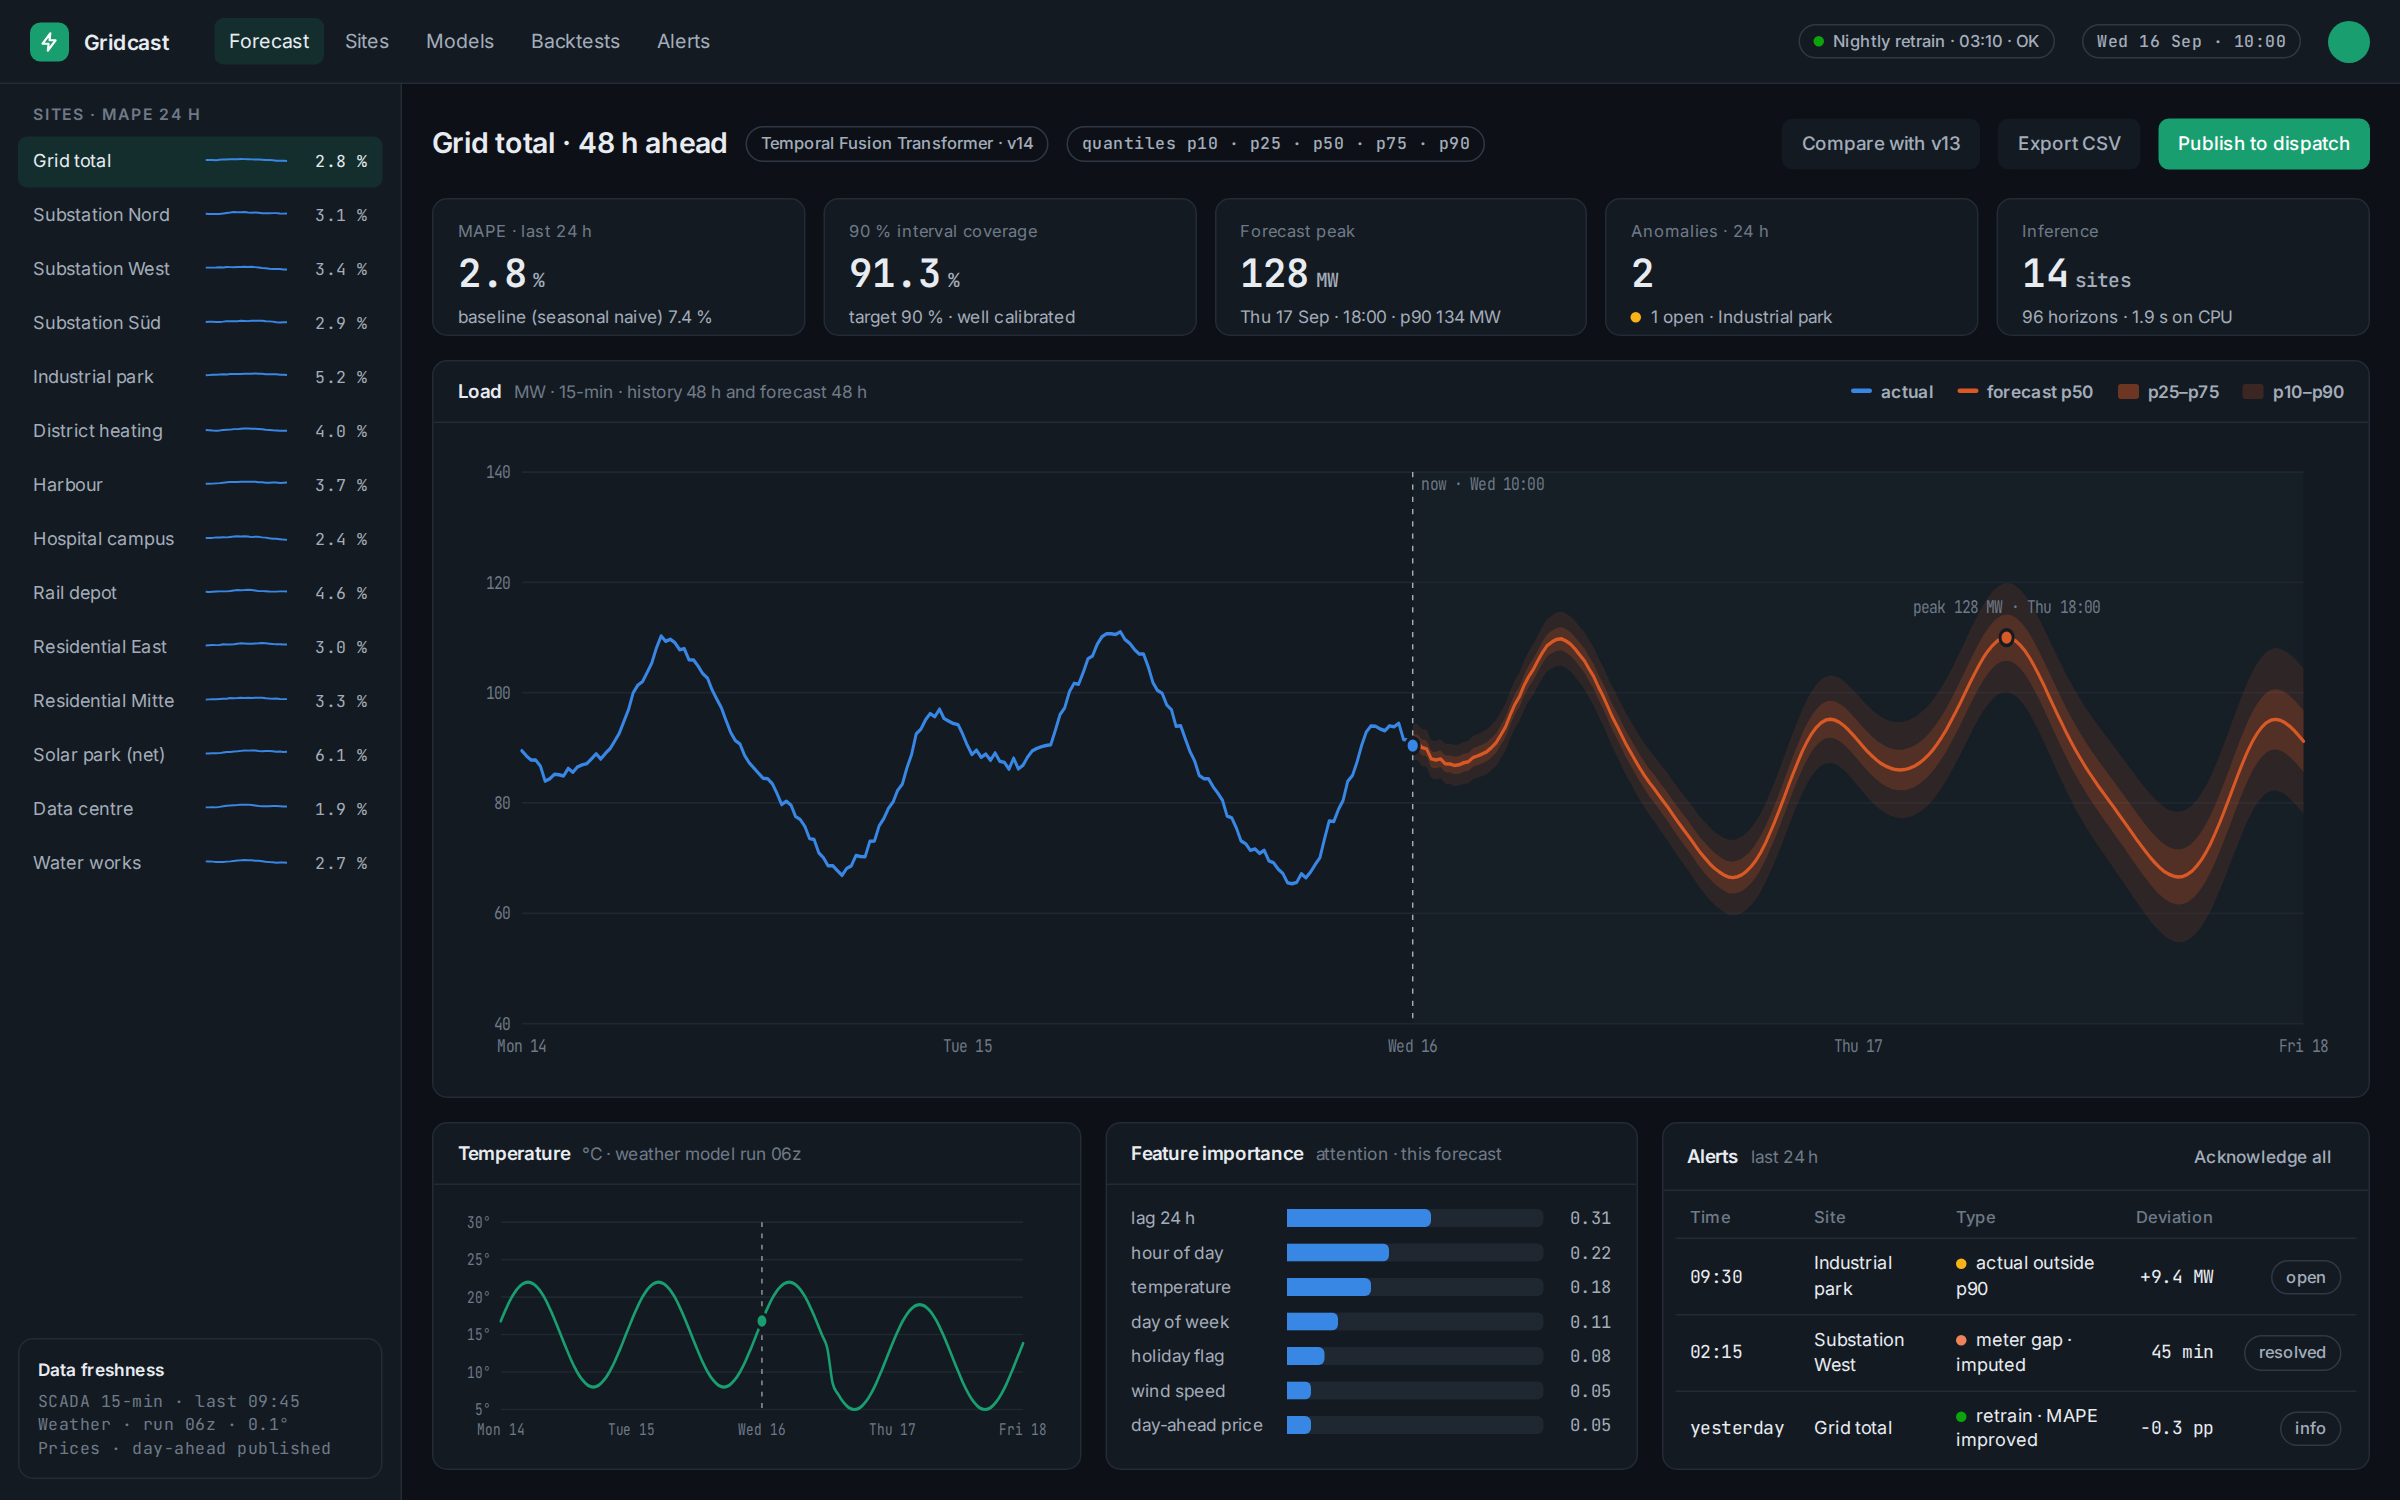
- A Temporal Fusion Transformer trained on three years of 15-minute SCADA readings for 14 sites, with weather forecasts, day-ahead prices, calendar and holiday features as known future inputs.
- Quantile outputs (p10, p25, p50, p75, p90) for every 15-minute step of the 48-hour horizon, so the dispatch team sees a band rather than a line and can plan reserves against it.
- A nightly retraining and backtesting job that promotes a new model version only if its rolling error and interval coverage beat the current one over the last four weeks.
- Anomaly flags whenever a measured value leaves the 90 % band, which double as an early warning for meter faults and unusual site behaviour.
Results
Over the last quarter the model averages 2.8 % MAPE at 24 hours ahead against 7.4 % for the seasonal baseline, and its 90 % interval covers 91.3 % of actual readings — calibrated rather than merely wide. Forecasts for all 14 sites and 96 horizons are produced in under two seconds on a CPU, and the attention weights show the dispatch team why a peak is expected, not just that it is.
The built-in interpretability turned out to matter as much as the accuracy: a forecast the team can explain is one they actually use.